The Top 10 SaaS Metrics for Rapid Growth
I personally love data (geeky I know!), and always have done. To me it’s as interesting as reading a good sci-fi novel (yes perhaps even geekier still!!). However, whether you enjoy analysing and interpreting data or not, it is essential for any SaaS company to be able to understand the key indicators that can be used to measure your performance over time, and utilise that information to help drive growth.
Therefore, I thought it would be handy to list and explain the most important and key metrics and formulas that SaaS businesses like you should be tracking if you want your product to grow and succeed.
Top 10 SaaS Growth Metrics
- Average Return Per User (ARPU)
- Monthly Recurring Revenues (MRR) or Annual Recurring Revenues (ARR)
- Monthly or Daily Active Users (MAU/DAU)
- Customer Acquisition Cost (CAC)
- Lifetime Value (LTV)
- Lead-to-Customer Conversion Rate (LCCR)
- Customer Churn Rate (CCR)
- Customer Retention Rate (CRR)
- Viral Coefficient (VC)
- North Star Metric (NSM)
1. Average Revenue per User (ARPU)
This metric is rather self-explanatory, but very useful to know to help you track and analyse your growth. Firstly, you will need to determine a time period to take each measurement, which will usually be monthly for most SaaS subscription products. Then you just need to determine the total revenue received from product sales i.e. number of packages sold multiplied by the price of those packages, and count the number of paying users within that given month and divide them.

2. Monthly Recurring Revenues (MRR) or Annual Recurring Revenues (ARR)
To calculate your MRR is simple, as you basically multiply the total number of users you have subscribed to your product at any one time, by the average revenue per user (ARPU above).

MRR is an important statistic for SaaS businesses since it is a predictable source of revenue, as long as you are gaining more users than losing them as mentioned above.
3. Monthly or Daily Active Users (MAU/DAU)
To find out your DAU or MAU, you just need to count the number of unique users your product has each day or month. For a SaaS business this is usually the number of unique users who have logged into the product on a given day and taken an action such as completing a task. Remember not to count the number of logins, as that could also include the same person logging in multiple times within a 24 hour period. Of course, the quicker your MAU/DAU climbs the better growth revenue prospects you can expect.
4. Customer Acquisition Cost (CAC)
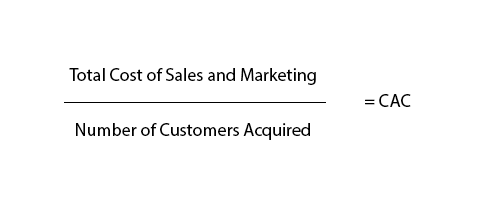
Your CAC is the total amount at which it costs to acquire new customers through your sales and marketing activities, which you can calculate by using the following formula:

Therefore, the lower your CAC the better as you want to be optimising your marketing spend as much as possible so that you can get more customers for a lower investment.
5. Lifetime Value (LTV)
This is the average value that a single customer brings to your company over the time they do business with you. So, for a SaaS company it would be the average price a customer pays to subscribe to your product multiplied by number of transactions within your subscription period, then multiplied by the average period of time that a customer stays with you before they churn.

We can use this in combination with the CAC to show how healthy your SaaS product is, as the more you can minimise costs and maximise the lifetime value of your customers the more successful you will be come. This is done by dividing your LTV with your CAC, and the rule of thumb we are heading towards is to have a ratio of at least 3, which means that you get three times as much revenue over the lifespan of a customer for what you spent to acquire them, as anything lower than that would not be worthwhile.

6. Lead-to-Customer Conversion Rate
To measure your lead-to-customer conversion rate you need to make sure that you track the full path of your website visitors through to their enquiry (or whichever conversion metric you decide makes a qualified lead), feeding their data into a CRM so you can determine when that same customer subscribes and makes their first payment for your product.
The formula which is used to calculate your lead-to-customer conversion rate is as follows:

Therefore if 10 of your leads from a given month convert into sales out of 200 leads in total, your lead-to-customer conversion rate would be 5%, which is a good minimum benchmark to aim towards.
7. Customer Churn Rate (CCR)
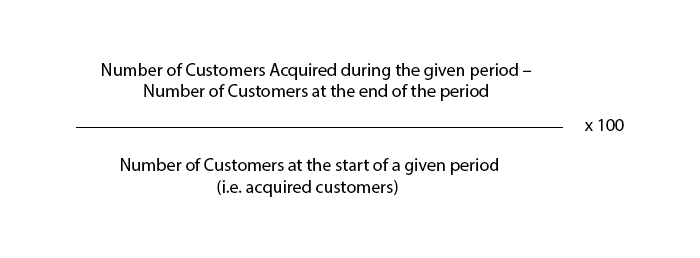
Churn is one of the most important metrics for SaaS companies, as it exemplifies when customers unsubscribe or stop paying for your product. Therefore, the churn rate is the percentage of subscribers that don’t renew their subscriptions within a given time period.
This is calculated by the number of customers who leave a product over a given time, divided by the total remaining customers as the below equation demonstrates:

If you have high a churn rate it means that you may not be covering your CAC outlined above as it negatively affects LTV negatively
8. Customer Retention Rate (CRR)
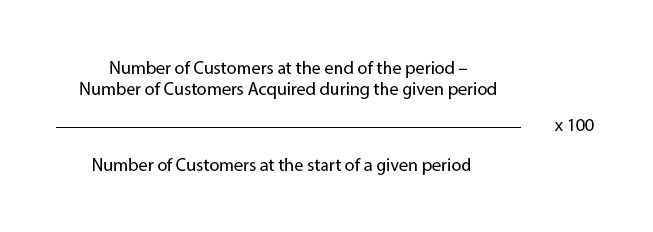
The opposite of churn is retention, so this brings us nicely onto our Customer Retention Rate metric. In contrast to churn, customer retention is expressed as a percentage of the customers that remain loyal to the organisation. Therefore, we use almost exactly the same formula as above, but flip the variables around so it will be:

Therefore, if your churn rate is 10% your retention rate will be 90%. You just need to decide which metric is more important to help your specific business goals and objectives, whether that be to increase brand loyalty, or reduce product attrition for example.
9. Viral Coefficient
With SaaS start-ups especially, there is great emphasis placed on viral marketing through product referral schemes and incentives. The Viral Coefficient, also known as the K Factor (from its algebraic symbol within the equation), is the metric used to measure the virality of a product, which you can calculate using the below formula:

Therefore, if you currently have 100 users who each sent an invitation out to 10 of their friends or contacts, and 20% of them convert into paying customers, the equation will be 100 x 10 x 0.2 (150 new users in total) / 100, which gives you a Viral Coefficient of 2, meaning for every user you sign up, you will get an additional 2 users through referrals. So, that being said, a Viral Coefficient of 1 or more is a good aim.
10. North Start Metric (NSM)
The North Star Metric is a term coined by Sean Ellis, the author and start-up investor, who also invented the word ‘growth hacking’.
The idea with the North Star Metric is to have one main metric (or the ‘one metric to rule them all!’ for you Tolkien lovers), to which every department of the company is aware of and can work toward, which intrinsically measures the value your product expresses to your customers. For example, for Facebook it is Monthly Active Users, Airbnb is the number of nights booked, WhatsApp number of messages sent, Spotify is time spent listening, Uber rides per week, etc. Most commonly with B2B SaaS products, it is either monthly or daily active users (MAU or DAU), as the usage frequency determined the value of the product in the eye of the customer, not MRR, which can be dangerous to set as your NSM, as this could be more attributed to gaining short term profits (such as a hike in price) than building long term customer value.
In conclusion, you should track the above metrics regularly, in fact, make them part of your daily reporting dashboard. Then analyse the data and cross-reference with any product iterations or marketing campaigns you are running during that period to spot trends and insights into what is working and what is not. This will allow you to optimise and scale, which is fundamental to achieve rapid exponential growth for your SaaS!


Leave a comment: